Censible launched as a name no AI assistant had heard of. A brand, a website and a search plan later, every one of them knows it, and traffic is up tenfold.
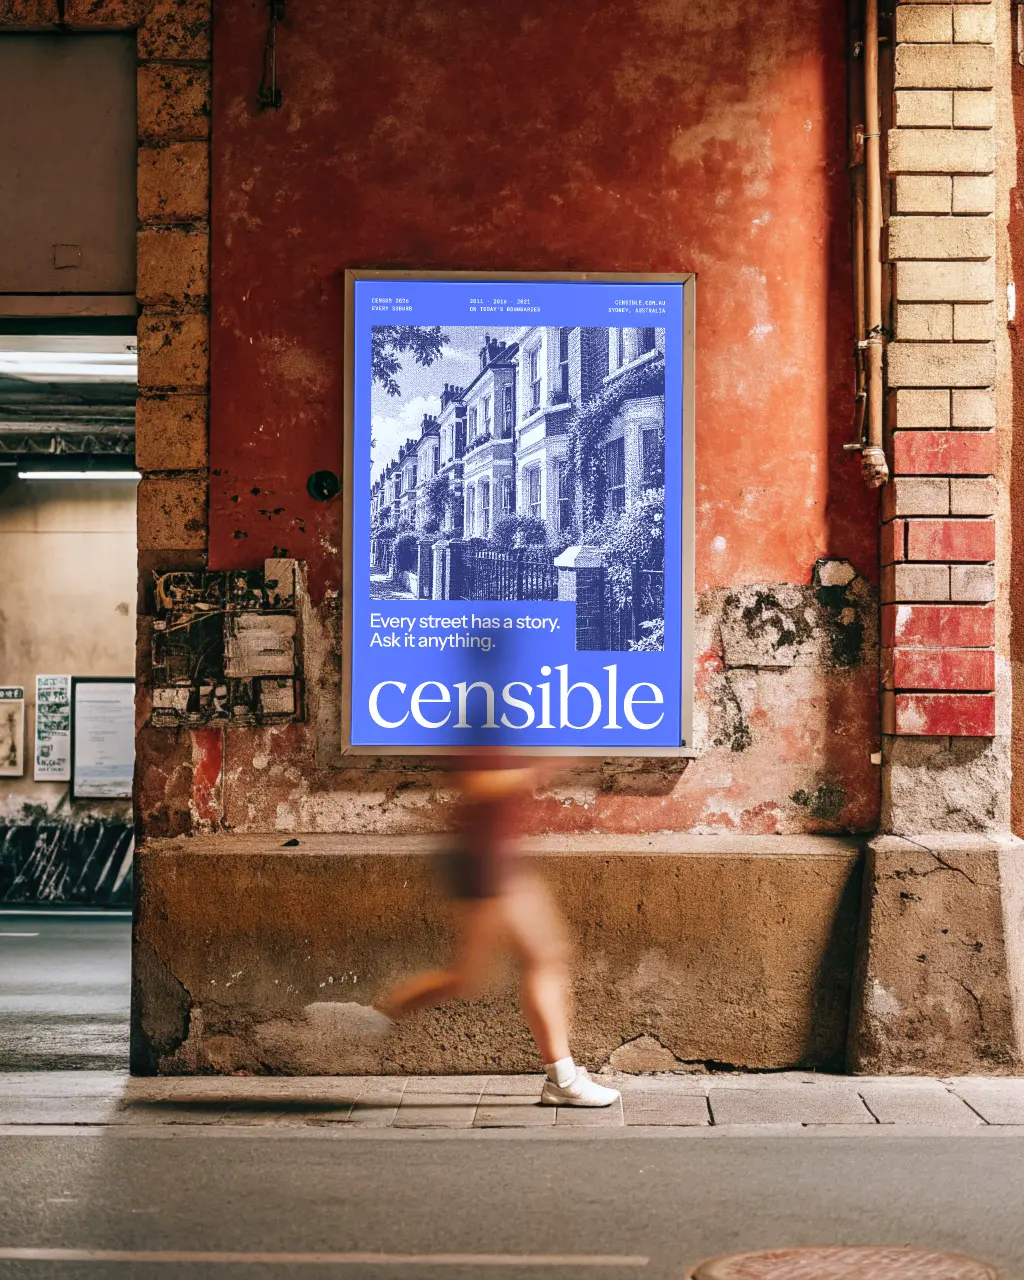
Censible is a new, AI-native census data platform from Sydney, setting out to modernise one of Australia’s most traditional industries. It needed a brand that looked like the product: digital, data-driven and built for now. Then it needed to be found. The work covered the brand, the website and the press kit, and search and AI visibility from the day it launched.
Census data has long been the domain of spreadsheets, PDFs and specialist consultants. Censible turns it into plain-English answers for any suburb, postcode or council, and gives AI products direct access through an API and MCP server. As a new brand entering a legacy industry, it had to earn trust from councils, property and finance teams on first contact, while signalling that this is a different kind of data company.
It also had to be found, starting from nothing. A brand-new name has no search history, no links and no press, and the AI assistants people now ask about suburbs had never heard of it. Anyone asking one about population growth or renters in their area got an answer that never mentioned Censible.
A C made of data points
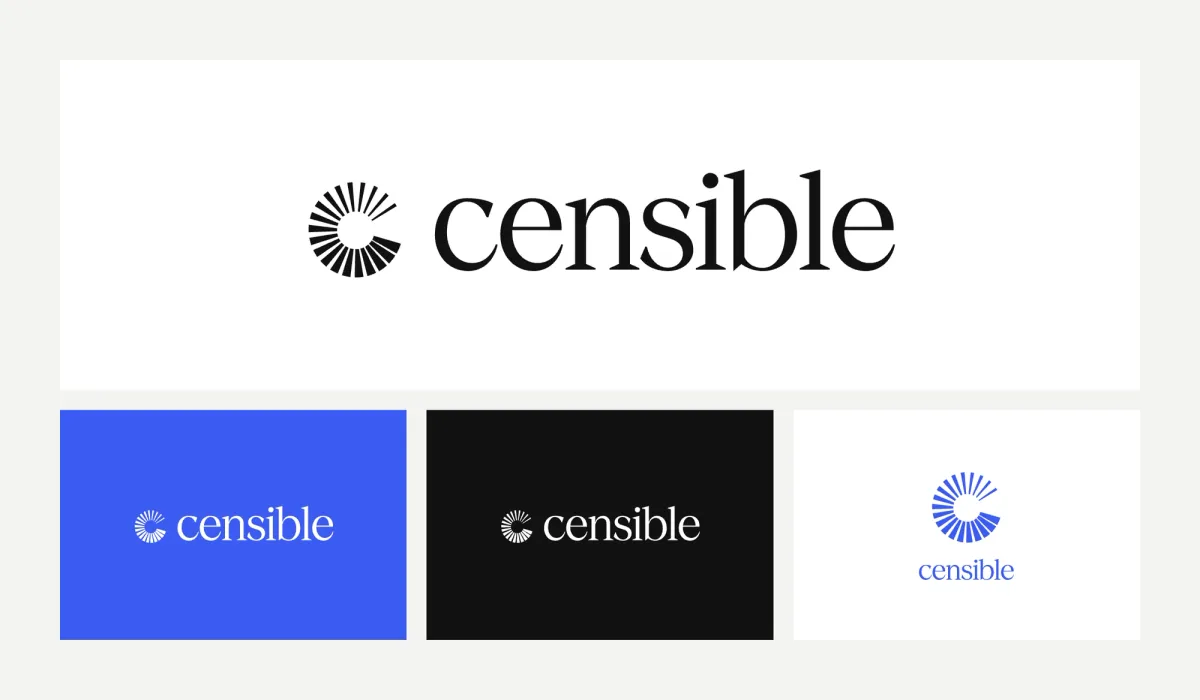
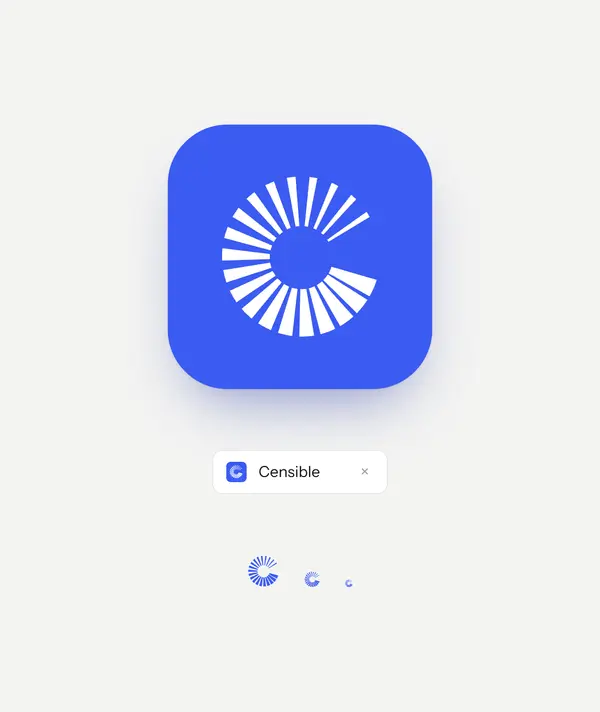
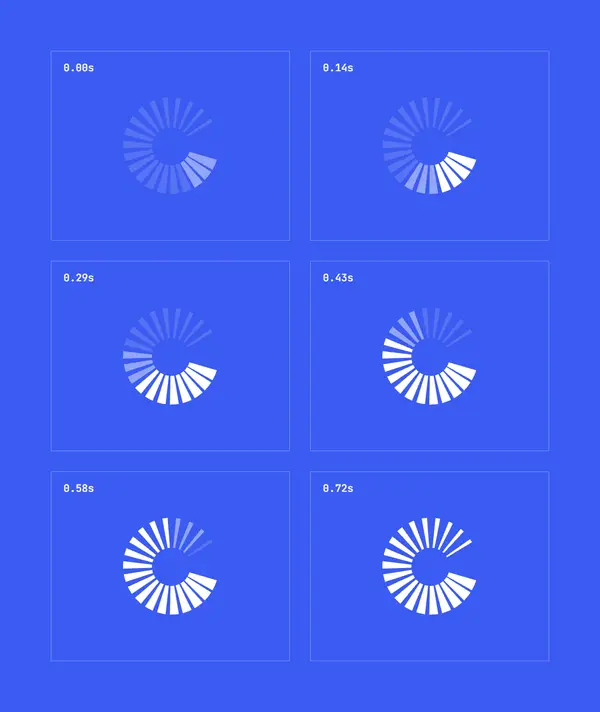
The brandmark is a C built from 20 rays around a single opening. Each ray stands for a data point, and together they read as a whole population, with a way in. It works as a solid symbol at 16px and as a loader, where the rays build in sequence while data arrives. Set in the data palette, every ray takes its own hue, so the mark doubles as a key to the colours that follow.
One lead colour, twelve to chart with
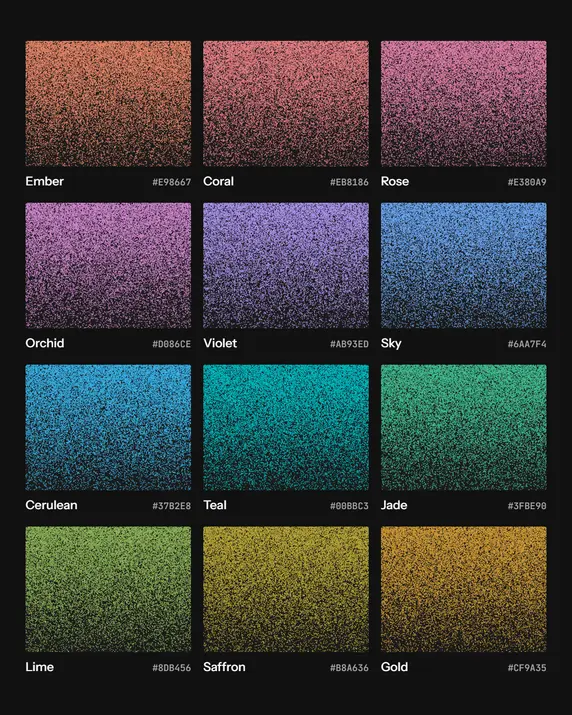
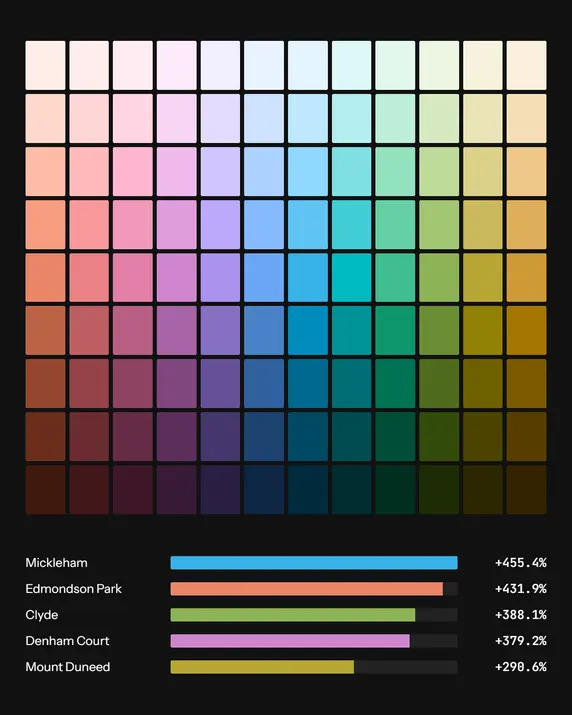
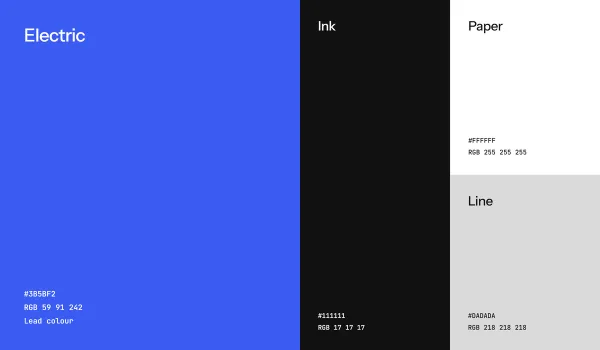
Electric blue leads, set against ink and white for clarity. Behind it sits a 12-hue data palette, tuned in OKLCH to a shared lightness and chroma so no colour outweighs another in a chart. Each hue carries a full tonal ramp from 100 to 900 for maps, charts and diverging scales. Electric is the brand’s own voice and the twelve hues belong to the data, so a chart never reads as decoration.
Figures that read as data
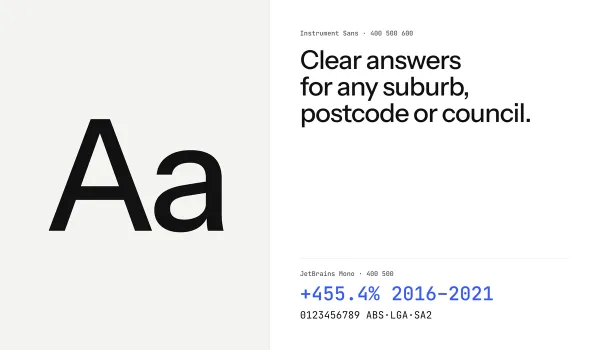
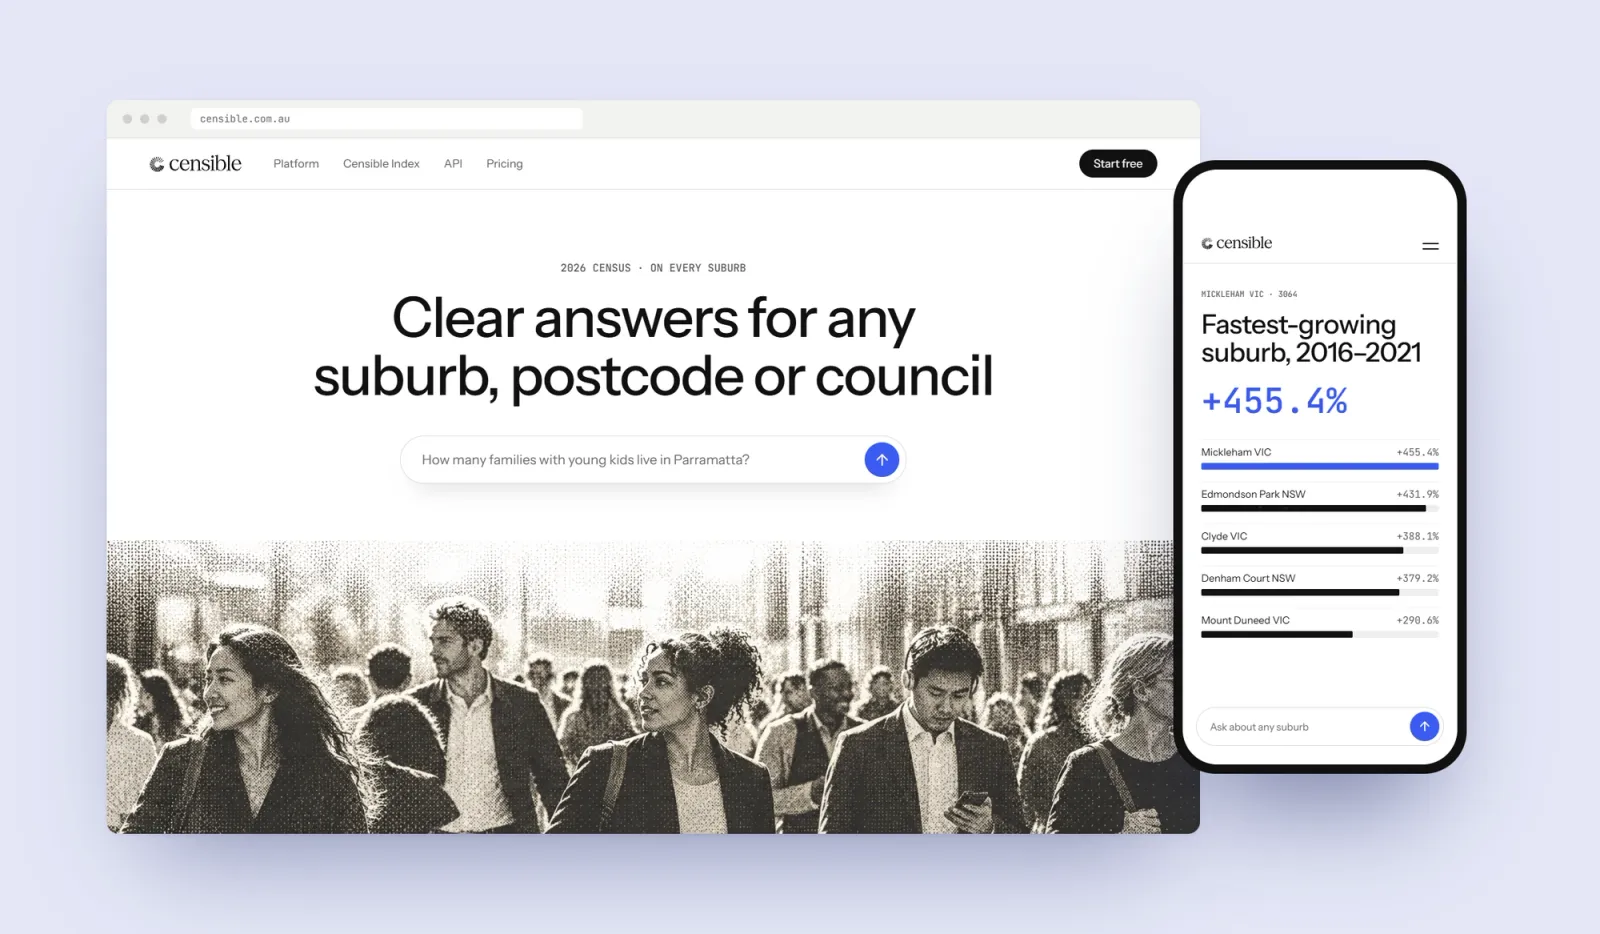
Instrument Sans carries the interface and headlines. JetBrains Mono handles figures, codes and sources, so numbers line up and read as data. A growth figure, a postcode and an ABS source line all sit in the same monospaced voice, which tells a reader at a glance which parts of the page are the evidence.
People first, drawn in dots
Census data is about people, so the imagery had to show them: a kitchen table at the end of the day, a street of terraces in summer, a new estate meeting open paddocks. A data company still has to look like one, so every photograph is printed in fine dots, like a picture on an old terminal screen. Up close it breaks into points, the way a population breaks into households. Step back and it is a street you know. The same treatment runs from the website to the posters.

An answer for every suburb
People ask about census data one place at a time, and so do AI assistants. The website is built the same way. Nearly 4,000 suburb pages and 466 council pages each open with a plain-English answer: how many people live there, how that has changed since 2016, the median age and the median household income, with the ABS named as the source in the same breath. Every page is marked up as a dataset, so search engines and AI assistants can tell which figure belongs to which place.
The Index, made for the news
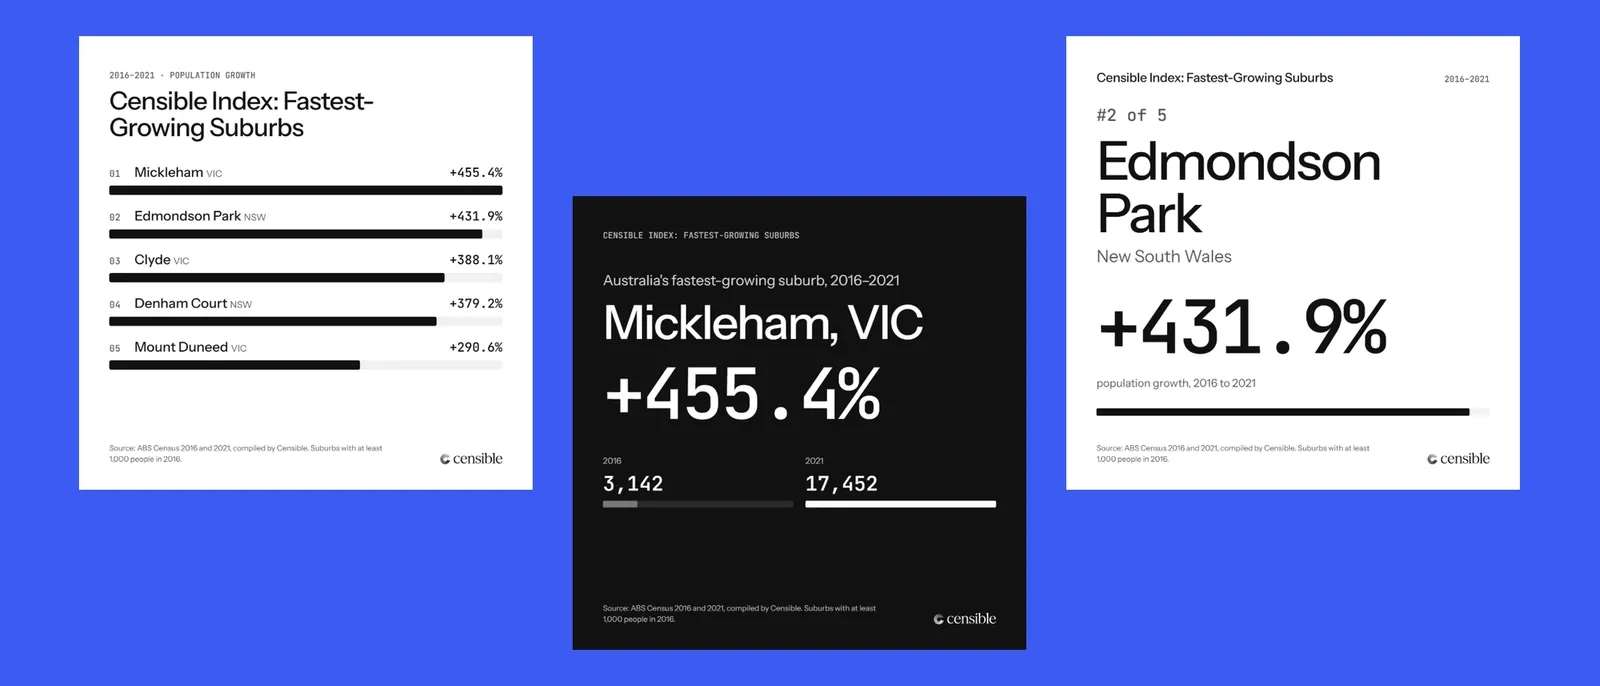
Census figures only become news when someone turns them into a story. The Censible Index does that: rankings built from ABS counts and written as headlines. The first found that Mickleham in Victoria was Australia’s fastest-growing suburb, up 455.4% from 3,142 to 17,452 people between the 2016 and 2021 Censuses. It launched with a ranking for every state, a social card for each result and a press release, and within its first week Censible was in the property press.
Known by every AI assistant
At the start, Censible did not exist as far as AI assistants were concerned. None of them knew who it was or what it did. A new name gets into those answers when the same facts are said the same way in many places, so every page, glossary entry and press release describes Censible in matching words. The site welcomes the bots AI assistants send to read the web by name, and a short llms.txt file tells them what Censible is and how its figures are made. The property coverage then gave them independent sources saying the same thing. Today every major AI assistant knows who Censible is.




Censible went from a name nobody knew to a brand that looks like its product and turns up where its customers look. Traffic to censible.com.au has grown tenfold. Every major AI assistant now knows who Censible is, where none did at the start, and the first Censible Index had it in the property press within a week. The brand, the website, the Index and the search work run on one set of rules, so every new ranking, suburb page and Census release adds to the same story. A 2026 Census hub is already live, ready to carry the first ABS results on release day in June 2027.